
Event space visualization represents a cutting-edge approach to managing physical venues and staff scheduling in the fast-paced world of event management. As organizations increasingly rely on sophisticated shift management capabilities, visualizing event spaces has emerged as a critical component for successful operations. This digital transformation allows managers to see real-time layouts, staffing distributions, resource allocations, and capacity utilizations across venues—turning abstract scheduling concepts into actionable visual insights. For businesses in hospitality, retail, and entertainment sectors especially, effective event space visualization bridges the gap between theoretical plans and practical execution.
The integration of event space visualization within shift management systems creates a powerful operational framework that addresses multiple challenges simultaneously. By providing clear visual representations of venue layouts, staff positioning, and workflow patterns, managers can make informed decisions about resource allocation, identify potential bottlenecks before they occur, and maximize space efficiency during peak periods. As technology in shift management continues to evolve, these visualization tools have become increasingly sophisticated—offering interactive elements, real-time updates, and predictive capabilities that transform how organizations plan, execute, and evaluate their events.
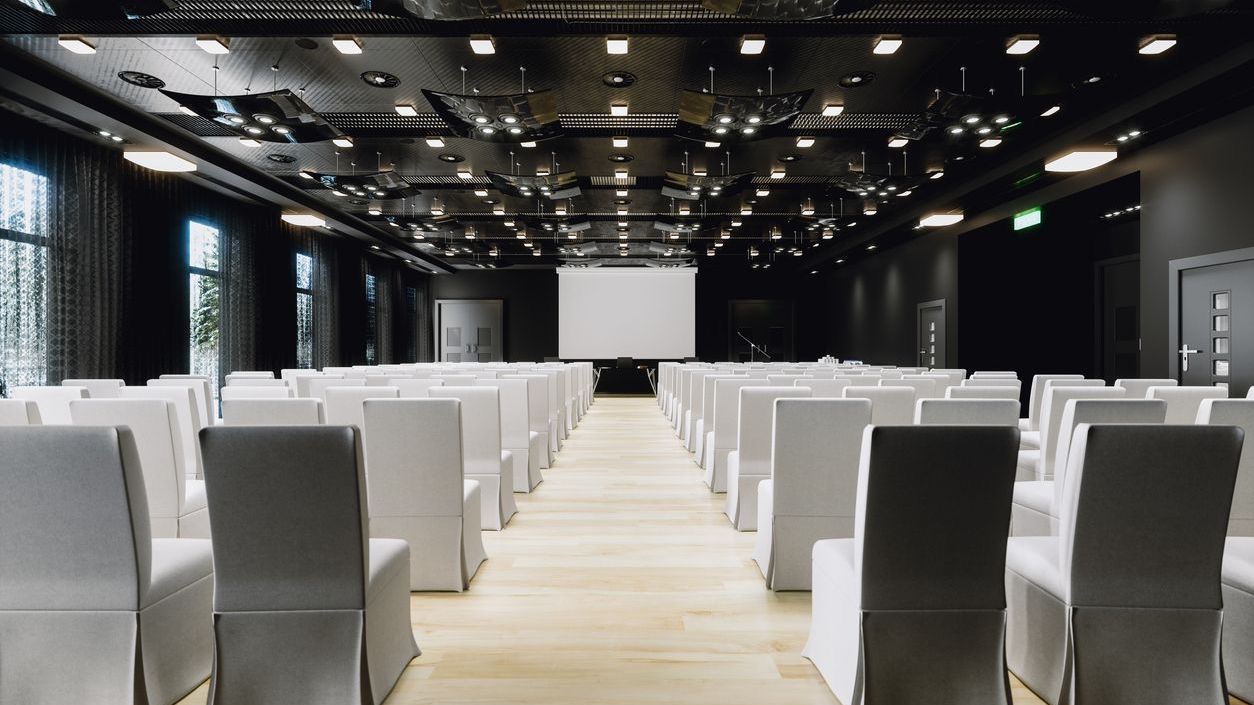
Understanding Event Space Visualization Fundamentals
Event space visualization serves as the visual backbone of modern event management, enabling managers to transform abstract scheduling concepts into tangible, interactive representations. At its core, this technology creates digital twins of physical venues that accurately mirror real-world dimensions, layouts, and characteristics. Unlike traditional floor plans, these dynamic visualizations exist within employee scheduling software ecosystems, allowing for real-time manipulation and scenario planning. Understanding the fundamental elements of these systems helps organizations maximize their operational efficiency.
- Digital Mapping: Accurate representations of physical spaces including room dimensions, entry/exit points, and fixed structures that impact staff movement and guest flow.
- Resource Overlays: Visual indicators showing where equipment, supplies, and staff are positioned throughout the venue.
- Capacity Visualization: Color-coded indicators showing occupancy levels, crowding potential, and optimal staffing ratios for different zones.
- Timeline Integration: The ability to visualize how space utilization changes throughout an event’s duration, often represented through time-lapse functionality.
- Staff Position Tracking: Real-time or planned positioning of team members throughout the venue, often with role identification.
These visualization components work together to create a comprehensive operational picture that supports both planning and real-time management decisions. Most modern platforms integrate these visuals with broader employee scheduling systems, creating a seamless connection between scheduling staff and visualizing their deployment. The technology has evolved significantly, moving from static diagrams to interactive, real-time models that change as conditions on the ground evolve.

Key Benefits of Event Space Visualization for Operations
Implementing effective event space visualization delivers substantial operational advantages that directly impact an organization’s bottom line. By transforming abstract scheduling data into intuitive visual formats, businesses gain unprecedented insight into their venue operations and staff deployment. This visibility creates efficiencies that ripple throughout the organization, from improved resource allocation to enhanced customer experiences. The return on investment becomes particularly evident when examining how visualization tools impact day-to-day operations and long-term planning.
- Optimized Staffing Distribution: Visual identification of overstaffed and understaffed areas, leading to balanced coverage and reduced labor costs.
- Reduced Scheduling Conflicts: Clear visualization of space allocations prevents double-booking areas and helps resolve overlapping staff assignments.
- Improved Response Time: Visual alerts for areas experiencing unexpected demand allow managers to quickly redeploy staff where needed.
- Enhanced Space Utilization: Identifying underused spaces and high-traffic areas helps optimize venue layouts and staff positioning.
- Better Guest Flow Management: Visual monitoring of crowd movement patterns improves service delivery and safety protocols.
These benefits are particularly valuable in high-volume operations where efficient space and staff management directly impact customer satisfaction and profitability. According to research highlighted in scheduling impact on business performance studies, organizations implementing visualization tools have reported operational efficiency improvements of up to 30% during peak event periods. The visual nature of these tools also significantly reduces the learning curve for new managers, who can quickly understand complex venue dynamics without extensive experience.
Essential Features of Advanced Event Space Visualization Tools
Not all event space visualization solutions offer the same capabilities, and the most effective platforms incorporate specific features that enhance their value within shift management systems. When evaluating potential solutions, organizations should look beyond basic floor plan displays to more sophisticated features that provide actionable insights and operational flexibility. Many of these capabilities are now standard in comprehensive scheduling tools with advanced features, though implementation quality can vary significantly between providers.
- Real-Time Updates: Immediate visual reflection of schedule changes, staff movements, and space reassignments as they occur.
- Drag-and-Drop Staff Assignment: Intuitive interfaces that allow managers to visually position staff members within the venue map.
- Heat Map Overlays: Visual representations of guest density, staff coverage, and service demand throughout the venue.
- Integration with Staff Communication: Direct messaging capabilities from the visualization interface to staff positioned in specific areas.
- Historical Comparison View: The ability to compare current space utilization with previous similar events for improved planning.
Advanced systems also incorporate robust reporting and analytics that transform visualization data into actionable insights. These reporting capabilities help identify patterns in space utilization, peak demand periods, and staffing efficiency that might otherwise go unnoticed. Leading solutions like Shyft combine these visualization features with comprehensive scheduling tools, creating a unified platform that addresses multiple operational needs simultaneously.
Integrating Event Space Visualization with Staff Scheduling
The true power of event space visualization emerges when it’s seamlessly integrated with staff scheduling systems. This integration creates a synchronized operational environment where changes in staffing instantly update spatial visualizations and vice versa. For example, when using Shyft’s platform, managers can see how scheduling decisions directly impact space utilization and make adjustments in real-time. This interconnected approach eliminates the information silos that frequently plague event management and creates a more responsive operational framework.
- Synchronized Updates: Schedule changes automatically reflect in the visualization interface, ensuring all stakeholders see current plans.
- Role-Based Visualization: Different staff roles appear with distinct visual indicators in the space visualization, showing coverage by function.
- Skill Mapping: Visual representation of where staff with specific skills or certifications are positioned throughout the venue.
- Schedule-Driven Alerts: Visual notifications when scheduled staff haven’t arrived at designated positions or when areas become understaffed.
- Shift Handover Visualization: Clear visual representation of staffing transitions between shifts to ensure continuous coverage.
This integration also supports more flexible staffing approaches, such as shift marketplace models where employees can trade shifts while maintaining appropriate spatial coverage. When staff exchange shifts through such systems, managers can immediately visualize the impact on event space coverage, ensuring that trades don’t create service gaps in critical areas. For organizations managing multiple venues or complex spaces, this visualization-scheduling integration becomes increasingly valuable as operational complexity grows.
Implementing Event Space Visualization: Best Practices
Successfully implementing event space visualization requires a strategic approach that balances technical considerations with organizational change management. Many implementation challenges arise not from the technology itself but from how it’s introduced and adopted within existing operations. Organizations should develop a clear implementation roadmap that includes training, testing, and continuous improvement phases. According to implementation best practices, a phased approach generally yields better results than attempting comprehensive deployment all at once.
- Accurate Space Mapping: Invest time in creating precise digital representations of your venues, including accurate measurements and structural features.
- Stakeholder Involvement: Include input from frontline managers and staff who understand the practical realities of the spaces being visualized.
- Integration Testing: Thoroughly test connections between visualization tools and existing scheduling systems before full deployment.
- Progressive Training: Implement training in stages, beginning with basic visualization concepts before advancing to more complex features.
- Pilot Area Launch: Start with a single venue or zone before expanding to additional spaces to refine processes and address issues.
Organizations should also consider how visualization tools will be accessed by different team members. Solutions with mobile schedule access enable staff to view their position assignments and understand spatial context even when not at a desktop computer. This mobile accessibility is particularly valuable for large venues where managers need to make decisions while moving throughout the space rather than remaining at a central command post.
Industry-Specific Applications of Event Space Visualization
While the core principles of event space visualization remain consistent across sectors, implementation details and priority features often vary by industry. Different business environments face unique challenges in managing their spaces and staff, requiring tailored visualization approaches. Understanding these industry-specific considerations helps organizations select and configure solutions that address their particular operational realities. These specialized applications demonstrate how visualization tools can be adapted to diverse business environments.
- Hospitality Sector: Hospitality businesses often require visualizations that show different service zones (dining areas, bars, lounges) with staff positioned according to service roles and guest flow patterns.
- Retail Operations: Retail visualization frequently emphasizes sales floor coverage, changing room assistance, checkout capacity, and seasonal display areas with corresponding staffing requirements.
- Event Venues: Dedicated event spaces benefit from visualizations that can be rapidly reconfigured for different events, with emphasis on flexible shift trading to accommodate variable schedules.
- Healthcare Facilities: Medical centers utilize visualizations that prioritize patient care zones, procedure rooms, and specialized staff positioning to ensure appropriate coverage for different types of care.
- Transportation Hubs: Airports and stations implement visualizations focusing on security checkpoints, customer service areas, and rapidly adjustable staffing to address passenger flow fluctuations.
These industry adaptations often involve customizing visualization tools to represent industry-specific spaces and staffing roles. Many organizations develop effective schedule templates that combine spatial configurations with staffing patterns optimized for their particular business models. These templates can then be adjusted for specific events or seasons while maintaining the core spatial and staffing relationships that drive operational success.
Leveraging Data Analytics with Event Space Visualization
The most sophisticated event space visualization platforms go beyond simple representation to incorporate advanced analytics that extract actionable insights from spatial and scheduling data. This analytical layer transforms visualization from a passive viewing tool into a strategic decision-making asset. By applying schedule data visualization techniques, organizations can identify patterns, predict challenges, and quantify the impact of different spatial arrangements on operational performance and guest experience.
- Traffic Pattern Analysis: Identifying common movement flows through spaces to optimize staff positioning and reduce congestion points.
- Service Time Correlation: Measuring how different spatial arrangements affect service delivery time and customer satisfaction.
- Staffing Efficiency Metrics: Calculating the optimal staff-to-space ratio for different event types and attendance levels.
- Capacity Utilization Tracking: Monitoring space usage over time to identify underutilized areas that could be repurposed or consolidated.
- Predictive Staffing Models: Using historical spatial data to forecast staffing needs for future events with similar configurations.
These analytical capabilities align with broader efforts to implement performance metrics for shift management that quantify operational success. By connecting spatial visualization with performance data, organizations can determine which layouts and staffing configurations consistently deliver the best results. This data-driven approach removes much of the guesswork from event planning and staff scheduling, replacing intuition with evidence-based decision making that improves over time as more data is collected.

The Role of Communication in Spatial Management
Even the most advanced visualization tools achieve limited results without effective team communication to support spatial awareness and staff coordination. Modern event space management requires seamless information flow between planning teams, on-site managers, and frontline staff. Integrated communication features within visualization platforms facilitate rapid response to changing conditions and ensure that all team members understand their spatial responsibilities. When visualization tools include robust team communication capabilities, organizations experience significantly improved operational coordination.
- Location-Based Messaging: The ability to send instructions to staff based on their position within the visualization map.
- Visual Alert Broadcasting: Pushing notifications that appear directly on staff visualization interfaces to highlight urgent spatial issues.
- Zone-Specific Updates: Sending information relevant to particular areas without distracting staff in other zones.
- Spatial Request Management: Allowing staff to request assistance or resources with automatic location tagging.
- Visual Confirmation System: Enabling staff to acknowledge position assignments with visual indicators on the management dashboard.
These communication features are particularly valuable during real-time scheduling adjustments when managers need to quickly redeploy staff in response to unexpected circumstances. The visual nature of these communications reduces confusion about where staff should be positioned and what they should be doing, especially in large or complex venues where verbal descriptions of locations might be ambiguous. This combination of visual clarity and immediate communication creates a more responsive and adaptable event management operation.
Future Trends in Event Space Visualization Technology
The field of event space visualization continues to evolve rapidly, with emerging technologies promising to deliver even more powerful capabilities in the coming years. Organizations planning long-term investments in visualization solutions should consider these future directions to ensure their selected platforms can adapt to changing technological landscapes. Several key trends are shaping the next generation of event space visualization tools, creating new possibilities for operational excellence and guest experience enhancement.
- Augmented Reality Overlays: AR applications that allow managers to see digital staff positioning and guest flow information while physically walking through spaces.
- AI-Powered Staffing Recommendations: Intelligent systems that suggest optimal staff positioning based on historical performance data and current conditions.
- IoT Integration: Connections with sensors throughout venues that provide real-time occupancy data automatically reflected in visualizations.
- Digital Twin Technology: Creating increasingly accurate virtual replicas of physical spaces that can simulate different staffing and layout scenarios.
- Predictive Analytics: Advanced modeling that forecasts how spaces will be utilized throughout events before they begin, enabling proactive adjustments.
These innovations represent significant advancements in how organizations visualize and manage their event spaces. As these technologies mature, they will likely become integrated features in comprehensive platforms rather than standalone solutions. Forward-thinking businesses are already exploring how these capabilities will enhance their operations, particularly as they relate to scheduling transformation initiatives that leverage advanced technology to improve operational performance.
Conclusion
Event space visualization has transformed from a nice-to-have feature into an essential component of effective shift management for event-focused organizations. By translating abstract scheduling data into intuitive visual formats, these tools enable managers to make more informed decisions, optimize resource allocation, and enhance guest experiences. The integration of visualization capabilities with comprehensive scheduling platforms creates powerful operational synergies that address multiple business challenges simultaneously. As visualization technology continues to evolve, organizations that adopt these tools gain significant competitive advantages through improved efficiency, reduced costs, and enhanced service delivery.
To maximize the benefits of event space visualization, organizations should prioritize solutions that offer seamless integration with existing systems, intuitive user interfaces, and robust analytical capabilities. The most successful implementations combine technology deployment with appropriate staff training and organizational change management. By embracing visualization as a core component of their operational strategy, businesses can create more responsive, data-driven event management approaches that adapt quickly to changing conditions. In the increasingly competitive landscape of event management, space visualization has become not just a technological enhancement but a strategic necessity for operational excellence.
FAQ
1. How does event space visualization improve staff efficiency?
Event space visualization improves staff efficiency by providing clear visual representations of where team members should be positioned, eliminating confusion about assignments and reducing time spent clarifying locations. Managers can identify overstaffed and understaffed areas at a glance, enabling quick redeployment of resources where they’re most needed. These tools also help optimize walking paths and station placement, reducing unnecessary movement and improving service delivery timing. Additionally, when integrated with scheduling systems, visualization tools ensure that staffing levels match actual space needs rather than theoretical estimates, preventing both labor waste and service gaps.
2. What features should I look for in event space visualization software?
When evaluating event space visualization software, prioritize solutions with accurate mapping capabilities that precisely represent your venues, including all relevant structural features. Look for real-time updating that reflects schedule changes immediately in the visualization interface. The system should offer intuitive drag-and-drop functionality for staff positioning and zone management. Integration capabilities with your existing scheduling, communication, and analytical tools are essential for creating a unified operational environment. Finally, consider mobile accessibility features that allow managers and staff to view and interact with visualizations from anywhere in the venue, not just from fixed workstations.
3. Can small businesses benefit from event space visualization tools?
Yes, small businesses can realize significant benefits from event space visualization tools, often with faster implementation timelines than larger organizations. Even with limited venues and staff, visualization helps small businesses maximize resource utilization—a critical factor when operating with tight margins and limited personnel. Many platforms now offer scalable solutions with pricing models appropriate for smaller operations, providing core visualization capabilities without unnecessary complexity. Small businesses typically experience immediate gains in scheduling efficiency, reduced operational confusion, and improved customer service positioning. As these organizations grow, their visualization systems can scale accordingly, providing continuity in operational practices throughout their development.
4. How does event space visualization integrate with other business systems?
Modern event space visualization platforms offer extensive integration capabilities with other business systems through APIs, webhooks, and direct connections. These integrations typically include employee scheduling software, allowing visualization of scheduled staff within venue maps. Point-of-sale system integration can display transaction volumes spatially, highlighting high-activity areas. Workforce management systems synchronize time and attendance data with spatial positioning. Customer relationship management tools can overlay customer data onto venue maps for personalized service delivery. Additionally, building management systems may connect to visualization tools to incorporate environmental factors like temperature and lighting into operational planning. The best implementations create a seamless data flow across systems, eliminating redundant data entry and ensuring consistent information throughout the organization.
5. What ROI can organizations expect from implementing event space visualization?
Organizations implementing event space visualization typically see return on investment through multiple channels, with most achieving measurable benefits within 3-6 months of full deployment. Labor cost optimization is usually the most significant financial benefit, with businesses reporting 10-15% reductions in unnecessary overtime and overstaffing. Operational efficiency improvements, including faster service delivery and reduced guest complaints, typically generate 5-12% increases in customer satisfaction scores. Additional revenue opportunities emerge through optimized space utilization, allowing for increased capacity or enhanced premium service areas. While implementation costs vary based on venue complexity and integration requirements, most organizations find that visualization tools pay for themselves within 8-12 months through direct cost savings and enhanced revenue generation.


